
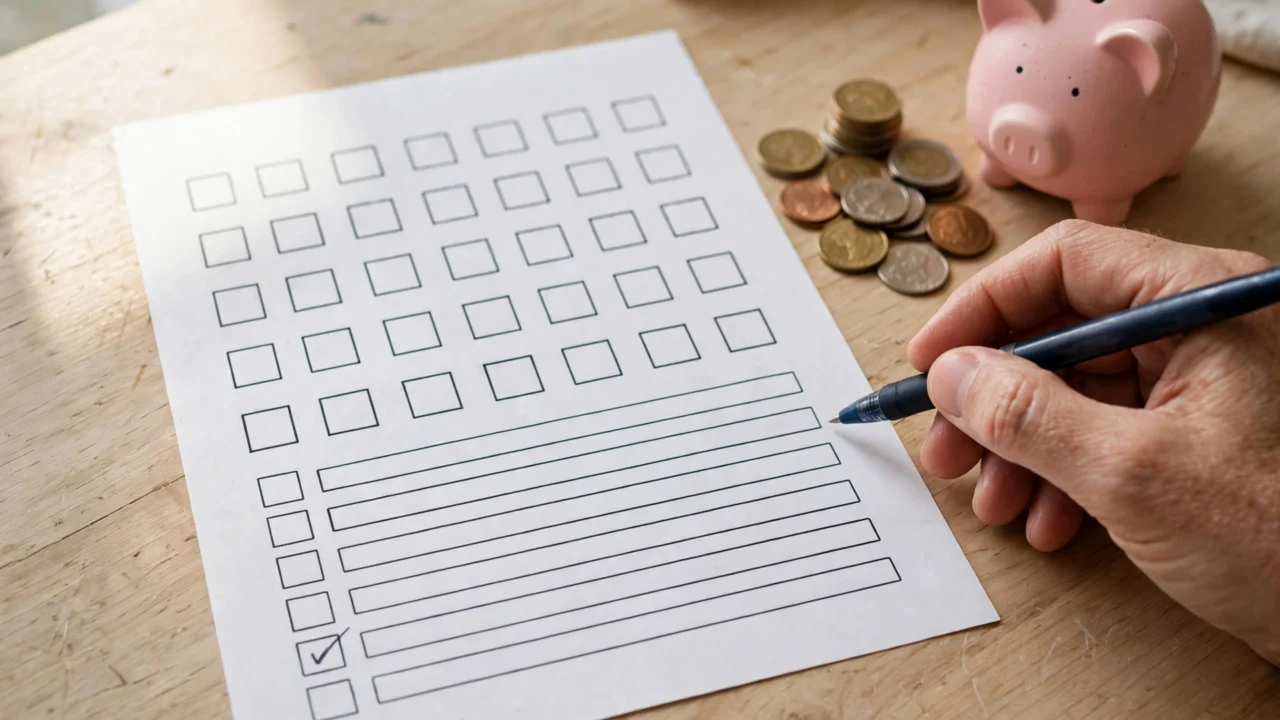





A money saving chart is one of the simplest tools in personal finance — a single page where you colour in, tick off, or shade each amount you save until you reach your goal. It sounds almost too basic to work, yet the visual feedback it gives is exactly what most budgets lack. When you can see your progress filling up, saving stops feeling like deprivation and starts feeling like a game you are winning.
How a money saving chart works
The idea is straightforward. You pick a savings goal and an amount, then break that amount into small boxes, bars, or rows on a chart. Every time you save, you mark off the matching section. Watching the chart fill up gives you a small hit of satisfaction each time — the same psychology that makes fitness trackers and to-do lists so addictive.
Unlike a spreadsheet buried in an app, a money saving chart lives somewhere visible: pinned to the fridge, taped inside a wardrobe door, or tucked into the front of your planner. That visibility matters. Out of sight really does mean out of mind when it comes to money.

Why visual tracking beats willpower
Most people do not fail to save because they lack discipline. They fail because saving is invisible. Money quietly sits in an account, and there is no satisfying moment of progress. A money saving chart fixes that by making every deposit tangible.
There is also a useful side effect: a half-filled chart is motivating in a way an empty savings account is not. Behavioural researchers call this the endowed progress effect — once you have started something, you want to finish it. The first few coloured-in boxes do the heavy lifting of getting you going, and the growing streak does the rest.
Popular money saving chart ideas
The 52-week chart
The classic: save a little more each week for a year. Week one you save a small amount, week two slightly more, and so on. By week 52 the weekly amounts feel substantial, but you have built up to them gradually. It suits anyone whose income is steady and who likes a clear, fixed target.
The 100-envelope style chart
Instead of weeks, the chart has 100 numbered boxes. Each time you save, you pick any box and colour it in. The flexibility is the point — on a tight week you colour a small box, on a good week a big one. It works well for freelancers or anyone with irregular income. If your pay varies month to month, our guide to budgeting on irregular income pairs nicely with this approach.
The no-spend or savings thermometer
A thermometer chart is perfect for a single big goal — a holiday, a car deposit, an emergency fund. You draw a tall thermometer, mark the target at the top, and shade it upward as savings grow. It is satisfying precisely because the goal is one clear number. Speaking of which, if you are still defining the target, our walkthrough on setting financial goals you can actually stick to will help you pick a figure that is ambitious but realistic.

How to make your own money saving chart
You do not need design skills or special software. Here is a simple method:
- Pick one goal. One chart per goal. “Holiday fund” or “new laptop” works; “save more generally” does not.
- Set the total. Decide the exact amount you want to reach and by when.
- Break it into boxes. Divide the total into 25, 52, or 100 chunks — whatever feels like satisfying progress per deposit.
- Draw it simply. Boxes, bars, or a thermometer on a single sheet of paper. Keep it clean enough that colouring it in feels rewarding.
- Put it where you will see it. Fridge door, bathroom mirror, inside a cupboard you open daily.
- Mark it immediately. Colour in the box the moment you move the money — the reward has to follow the action.
Pairing your chart with a real savings plan
A chart tracks saving; it does not create the money. For the chart to work, the saving itself needs to be automatic. Set up a standing order that moves money to a separate savings account on payday, then colour in the chart to match. The automation does the disciplined part; the chart supplies the motivation.
It also helps to keep the chart’s money separate from everyday spending. A dedicated savings pot — even a basic instant-access account — stops the saved money from quietly leaking back into spending. If you are unsure how savings accounts grow your money, our explainer on how savings account interest works covers the basics.
Common mistakes to avoid
- Setting the boxes too big. If each box represents a painful amount, you will stop filling them. Smaller, more frequent wins keep you going.
- Tracking too many goals at once. One chart, one goal. Finish it, celebrate, then start the next.
- Hiding the chart. A chart in a drawer is just paper. Visibility is the entire mechanism.
- Skipping the money movement. Colouring boxes without actually transferring the money is the fastest way to make the whole exercise meaningless.
The bottom line
A money saving chart will not earn you a promotion or cut your bills, but it solves the one problem most savings advice ignores: saving is boring and invisible. By turning progress into something you can see and touch, a simple chart keeps you engaged long enough for the habit to stick. Draw one this weekend for a single goal, put it somewhere you cannot miss, and start colouring. For a broader look at the official guidance on building a savings habit, the US Consumer Financial Protection Bureau’s saving resources at consumerfinance.gov are a solid, trustworthy starting point.